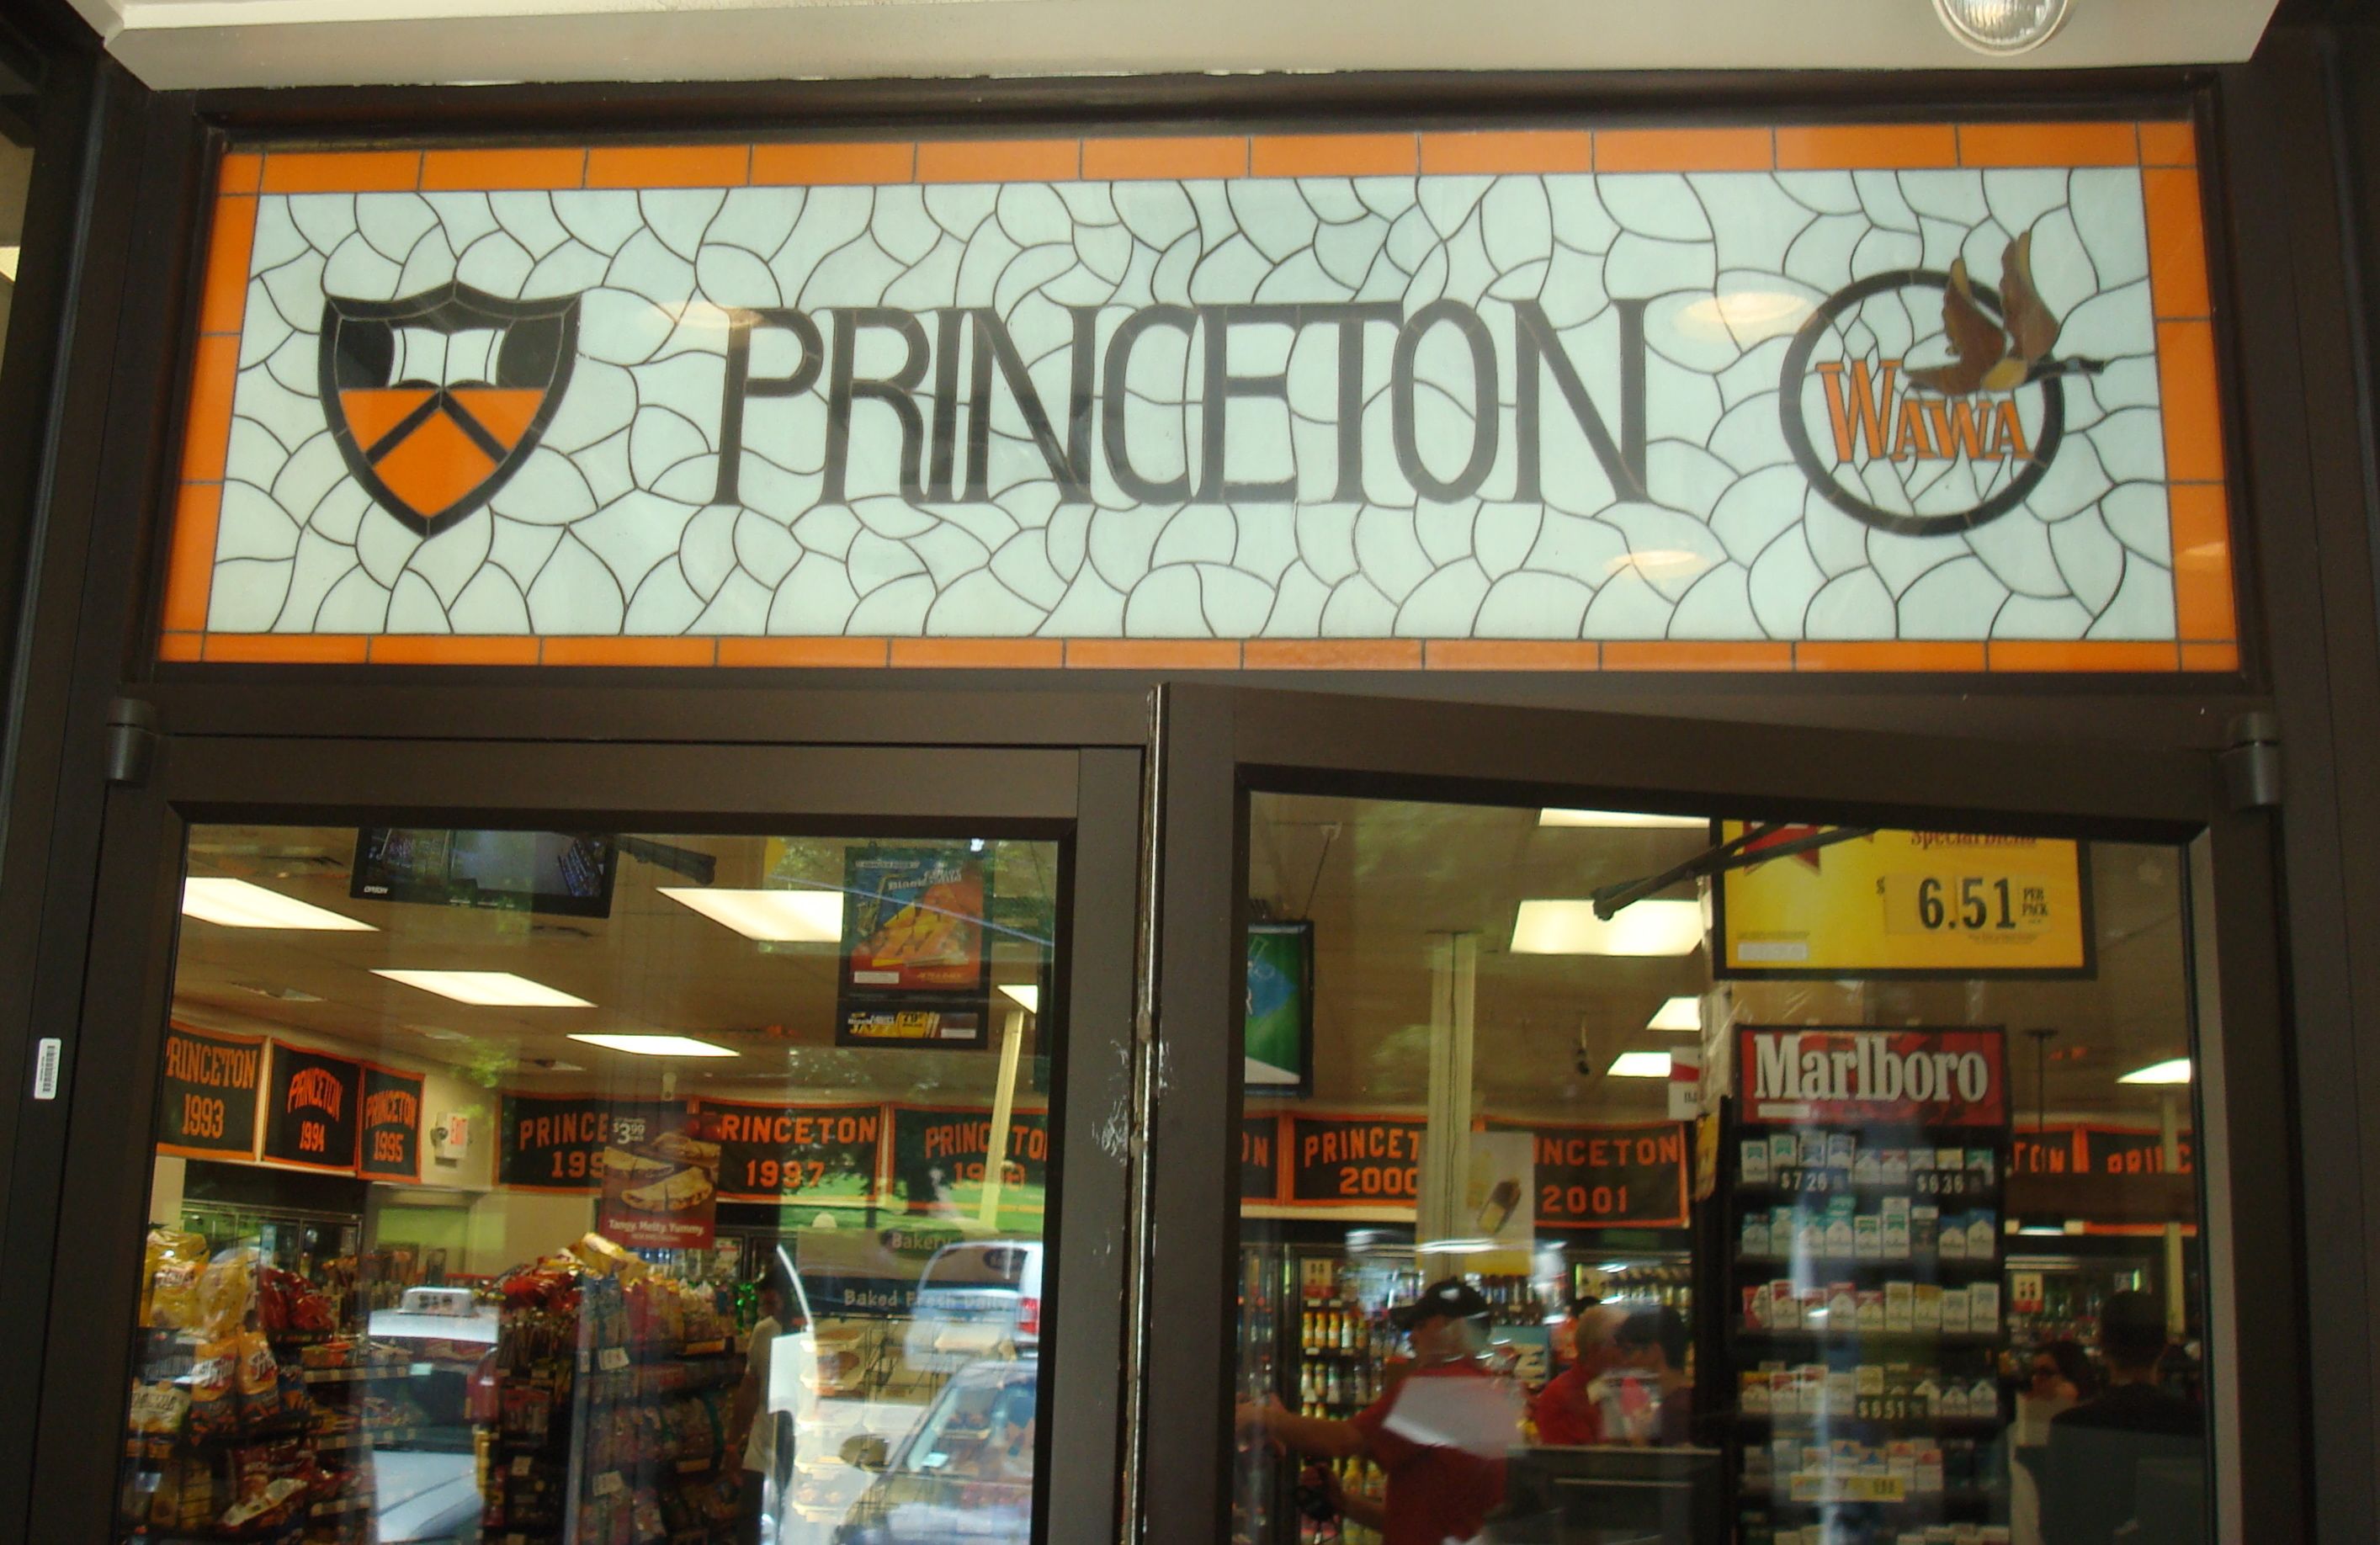
Entrance to the famous Princeton WaWa. (click to expand.)
It’s possible- no, likely- that there is no other store in Princeton that has enabled as many car-free shopping trips as the Alexander Street WaWa. For years, the WaWa has been the primary destination for students and locals looking for hot and cold food, milk, drinks, snacks and much more. Now, with the Princeton University Lewis Center expansion project proceeding apace, the WaWa enters its final semester before it will be demolished. Continue reading