

A couple of years ago, we got the first results from the 2020 US Census, which showed that the population of Princeton, NJ had grown to 30,681 (Report: “Princeton NJ population reaches 30,681 in 2020 Census“). That figure reflected a +7.4% increase on the 28,572 people who were counted in the old Borough and Township in the Census of 2010. In May of this year, a major new dataset released by the US Census Bureau, based on findings from the 2020 Census, gave us the chance to find out more about who these new Princeton residents are. How has the makeup of the town changed?
To get comparable figures for the US Censuses that happened in 2010 and 2020, we have to add together the 2010 figures from Princeton Borough and Princeton Township. That’s because the old Borough and Township were their own separate towns prior to consolidation in 2013. After doing that, we can see that in terms of age, all groups showed growth, but some much more than others. Princeton School Board officials have recently expressed concern about overcrowding in schools, but the number of under-18s in Princeton only grew by +5.5% over 10 years – a steady increase – but only equivalent to about 0.5% per year.
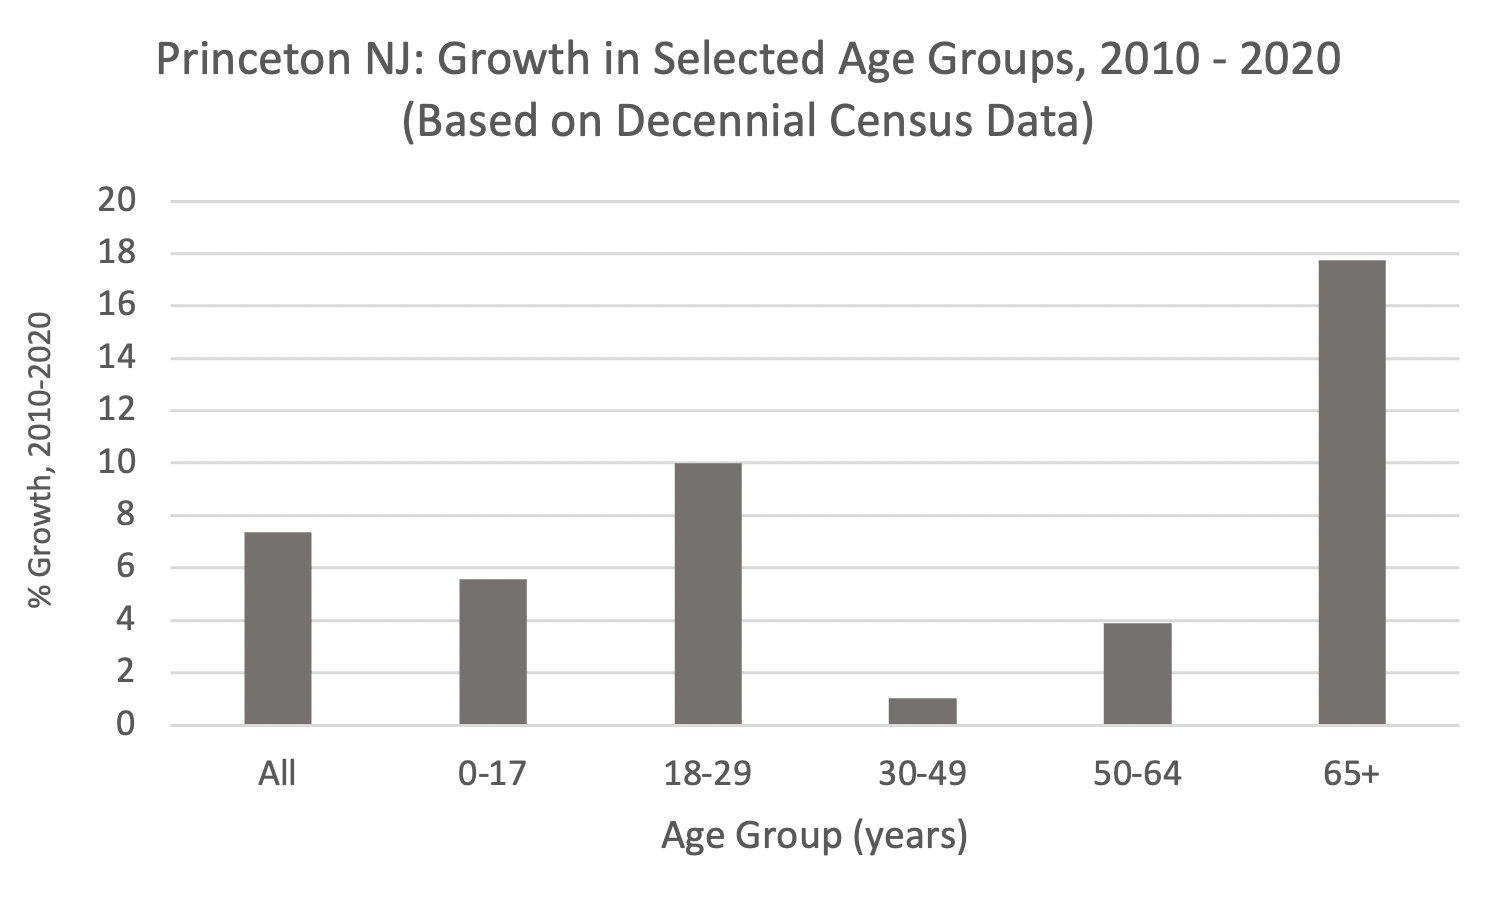
The number of young adults grew more quickly, with an overall increase over 10 years of +10%. An additional 866 people aged 18-30 called Princeton home in 2020 compared to 2010. Why are the numbers of young adults in Princeton increasing? A clue may come from Princeton University data from 2009-2010 and 2019-2020, which show that the total number of students at Princeton University increased from 7,592 to 8,419, an increase of 827 students.
In comparison, the number of Princeton residents in early middle-age (aged 30-49) barely budged betwen 2010 and 2020. Among people in late middle-age (50-64), there was a slight uptick of +3.9%. But the group that showed the biggest percentage increase leading into the last Census was the population of over-65s. Their number grew by +17.7%, far greater than the growth of any other age group. The Census figures strongly suggest that the growth in the population of the town is being driven largely by the expansion of Princeton University, and by seniors who are choosing to stay in or move to Princeton.
What about other demographic changes in Princeton? The latest Census data provides information on the racial background of homeowners and renters in Princeton. By considering only the occupants of the town’s 9,373 occupied housing units, we can mostly exclude students, who typically live in ‘group quarters’, which are categorized separately for Census purposes. In 2020, the town of Princeton had 5,363 homes that were owned by the residents, and 3,739 rented homes.
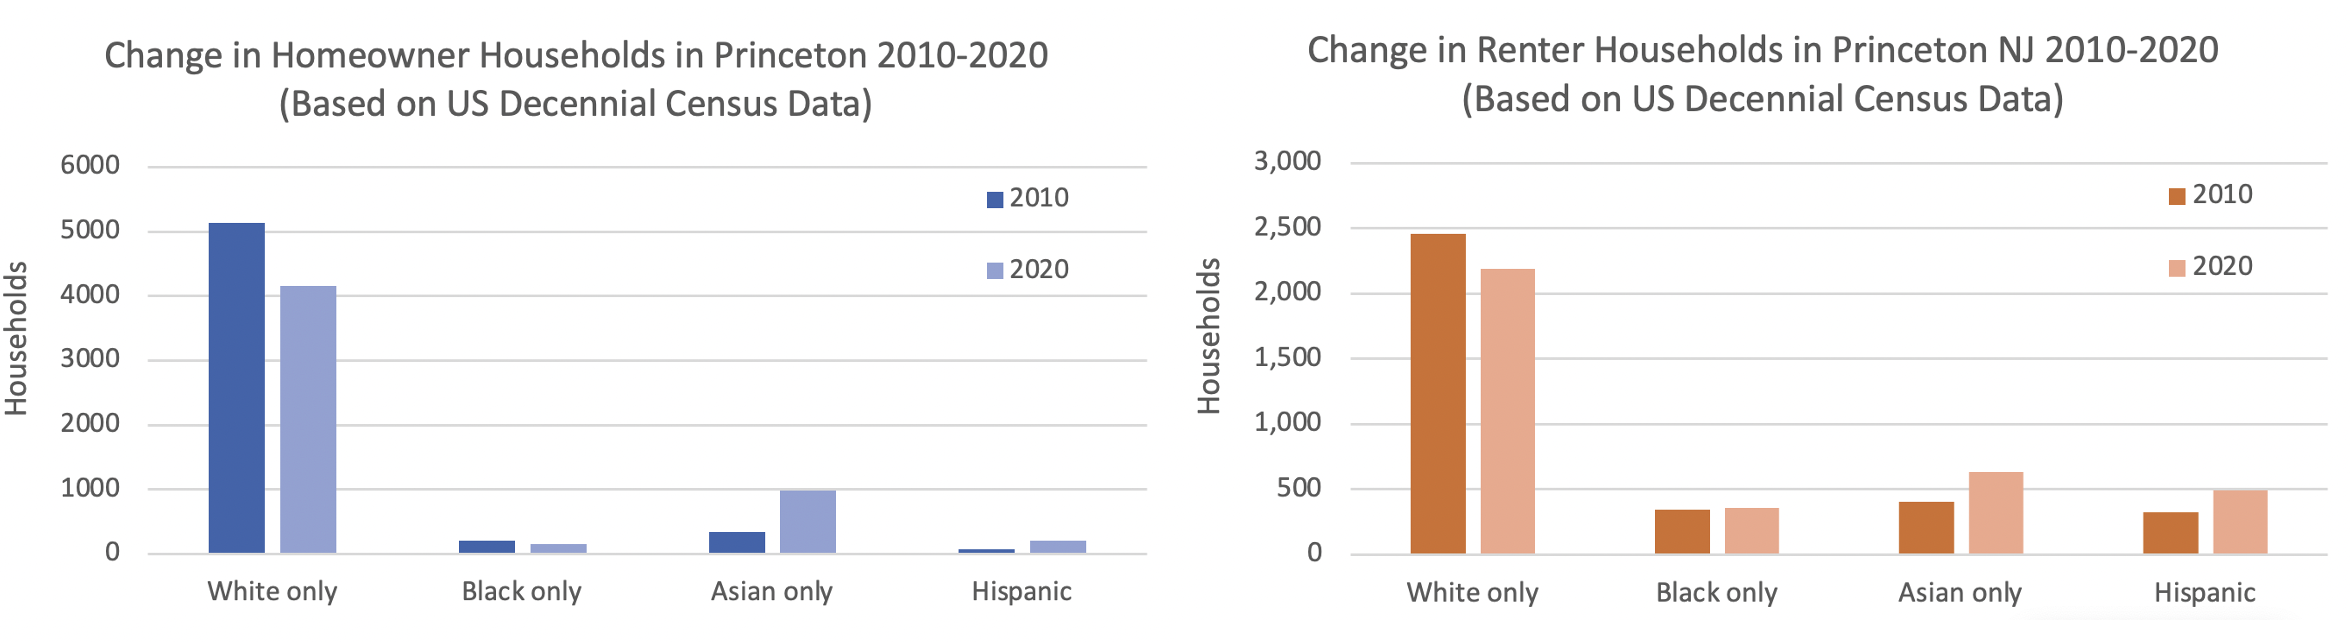
The data show that the nuber of homeowners identifying as “white only” dropped a lot between 2010 and 2020. Conversely, there was an increase in the number of homeowners who identified as Hispanic, and the number of Asian-only homeowners almost tripled. In general, Princeton residents identifying as “Black” or “Hispanic” were almost twice as likely to live in a rental as to own their own home. Whereas Asian-only and Hispanic households are growing in Princeton, the number of Black households showed a drop of about -7% in 2020 compared to 2010. Princeton is growing, but it is not growing equally, and the benefits of homeownership are still not being shared by all groups.
All of the files used for this analysis are available to download at https://data.census.gov.

Any chance you could check your math on the growth in the number of schoolchildren? I think you might mean an annual average (important, it’s not compounded) growth rate of 0.5%, not 0.05%. Please let me know if I’m not correct.
yes, whoops – decimal place error. fixed now. 0.5% is right.
Coincidentally, I’m also looking at percentage increases, but from the ACS, 2013 (the first year post-merger) vs. 2021. They tell a different story, which is interesting. Would your chart look different as percentage increases? Mine does, slightly; the 30-49 cohort shows a 9.6% increase, but the increase is a smaller absolute number than the 18-29 cohort’s increase, as yours is. And while the 18-29 cohort has a larger numerical increase, it’s a smaller percentage increase (6%). So I wonder what the best way is to represent these changes? (Rhetorical question unless you feel like answering, or adding a chart!)
It’s an ongoing debate, but I think ACS is fake news. I don’t mess with ACS estimates any more. A bad decennial Census is better than good estimates.